Philly Nonprofits by the Numbers—Financial Overview
Philadelphia is home to more than 2,200 nonprofit organizations (NPOs). These organizations perform important functions for maintaining the health of the city and its residents. Philly Nonprofits by the Numbers (PNBTN) is a monthly series published by the Gupta Governance Institute in its monthly newsletter. The series is aimed at providing stakeholders with insight into the Philadelphia nonprofit ecosystem. This month, we examine the geographic distribution of nonprofit revenue and assets.


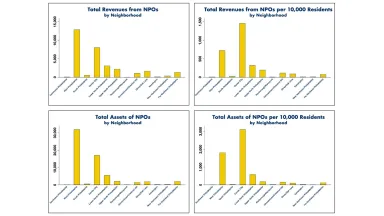
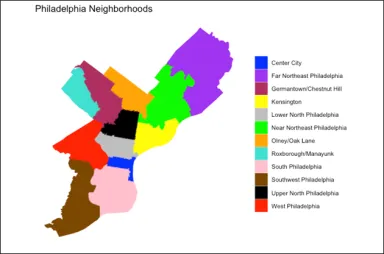
Nonprofit organizations located in West Philadelphia were responsible for the most nonprofit revenue in 2018. West Philadelphia is also the neighborhood with the most nonprofit assets. These facts point to the influence of some of Philadelphia’s largest nonprofit organizations. The University of Pennsylvania, The Children’s Hospital of Pennsylvania, Drexel University, and Presbyterian Medical Center are all located in West Philadelphia. Those four organizations are responsible for 20% of Philadelphia nonprofit revenues and maintain 24% of Philadelphia nonprofit assets. The concentration of financial resources in the top 10 organizations will be the subject of next month’s edition of PNBTN.
West Philadelphia does not rank as high in revenue and assets per capita. Nonprofit organizations located in Center City generate the most revenue per capita and maintain the most assets per capita of any neighborhood in Philadelphia. This dynamic is not unexpected, as there are more nonprofit organizations located in Center City than there are in any other neighborhood while Center City ranks eleventh in terms of population. West Philadelphia, by comparison, is the third most populated neighborhood.
Near Northeast Philadelphia is the neighborhood with the greatest population, but it ranks tenth in revenue per capita and eleventh in assets per capita. Olney/Oak Lane, the second most populated neighborhood, ranks sixth in revenue per capita and seventh in assets per capita.
As discussed in the October edition of PNBTN, concentration of NPOs and their financial resources in less populated areas does not necessarily imply that the neighborhoods with less organizations have access to less nonprofit programming and resources. Many organizations may headquarter their operations in Center City but offer their programming and services in other neighborhoods. Similarly, concentration of revenue and assets in Center City does not confirm that other neighborhoods are in disproportionate need of resources. However, as NPO assets are often land or buildings, the concentration of those assets in certain neighborhoods may point to the difficulty of offering nonprofit programming and resources in some parts of Philadelphia. Further investigation is needed on this topic.
Note: Data shown in charts above is displayed in $USD in millions from tax year 2018 and sourced from tax returns of nonprofit organizations filing IRS Form 990.

